Amber V2 components and performance research
We have built more than a framework core. Asset Pipeline has a reusable component system, a complete demo product, and an asset delivery path. Our performance work measures where time goes, tests focused changes, and preserves the results so the next contributor can build on them.
Retained research. The measurements below come from retained July, August, and September experiments. Their raw trials were reconciled in this pass; the cloud benchmarks were not rerun.
A component system you can use
FrontLoader supplies import maps, module preloads, script generation, and dependency analysis. Asset Pipeline’s StaticAssets compiler adds fingerprints, rewritten references, integrity manifests, and runtime lookup. The design system builds on that foundation with semantic HTML, theme tokens, and vanilla browser helpers.
Frontloader Studio demonstrates seven real page shapes: overview, pricing, forms, dashboard, timeline, collaboration, and interaction patterns. Buttons, dialogs, tabs, forms, tables, charts, page shells, layouts, and feedback primitives are reusable library components. The source is included in Asset Pipeline v0.37.0.
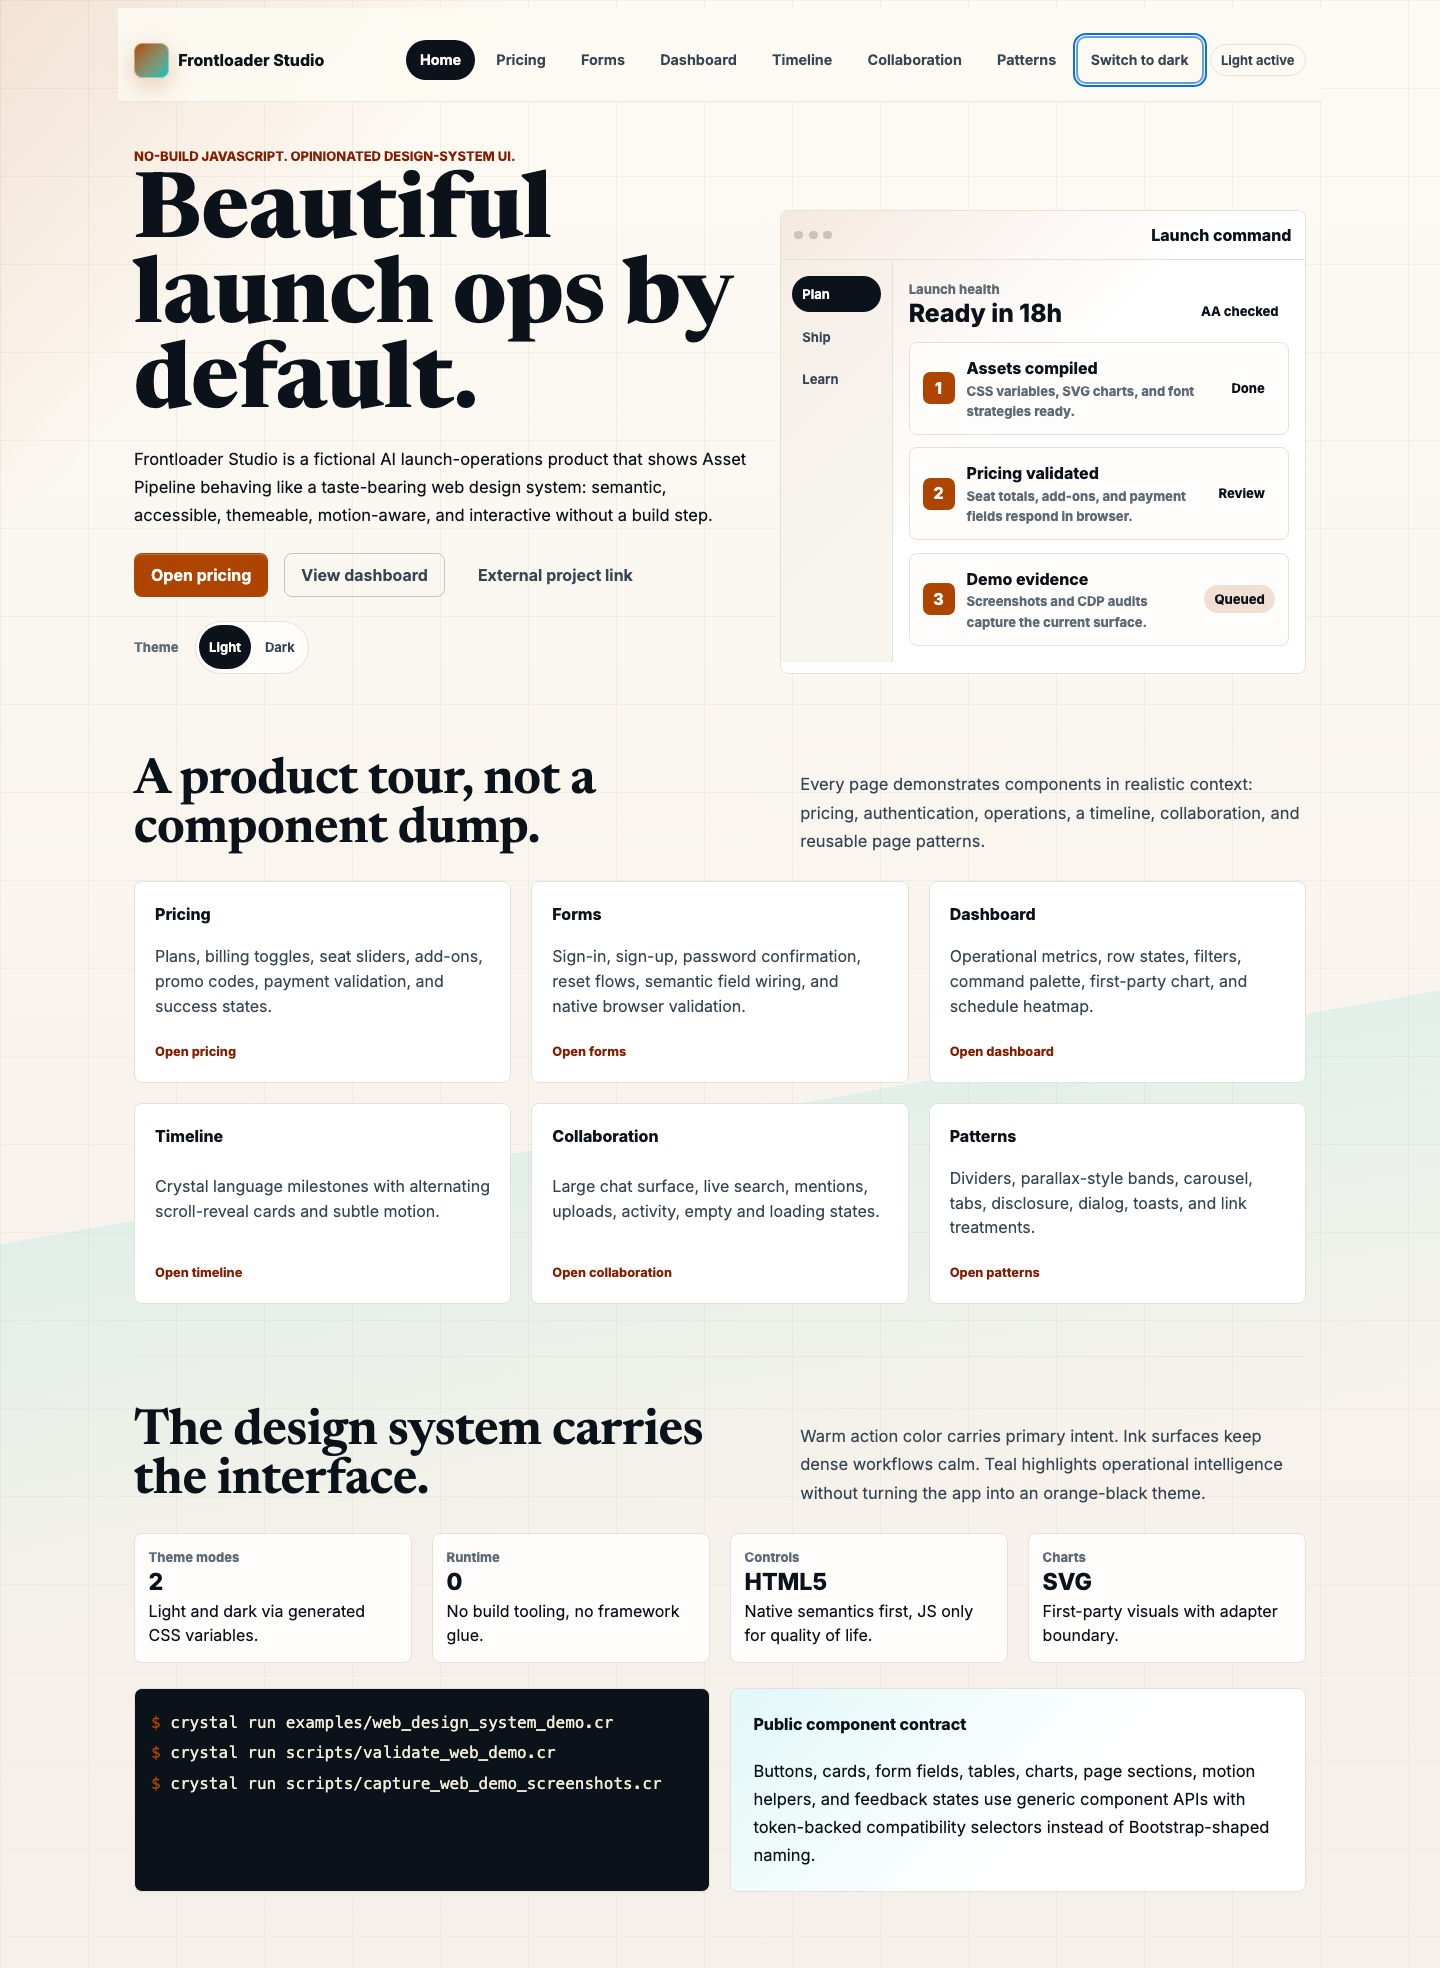
A fresh focused run passed 134 component and FrontLoader examples with zero failures, errors, or warnings. The retained static, axe, IBM, reduced-motion, and accessibility-tree reports pass. The retained combined browser audit has 100 findings to reconcile, so full browser acceptance remains open.
A faster core with a measured workload
The round-19 route matcher improved 3.33–4.05 times across the recorded mixed-route matrix. At 1,000 routes with consumed parameters, allocation fell from 871 to 130 bytes per match. The released beta.5 matcher is byte-identical to that measured implementation.
Complete localhost requests showed smaller gains: 6.5% for direct JSON and 12.2% for respond_with at 50 connections. The difference explains why we publish matcher, CPU-only request, and socket measurements with their own scope.
Hosted experiments with complete requests
A separate load generator sent a deterministic mixed workload through a 1,000-route Amber API on a one-shared-vCPU DigitalOcean target. Round 25 compared six body paths over seven rotating repetitions each.
| Body path | Median RPS | Paired gain | Wins |
|---|---|---|---|
| Generic JSON | 24,505 | Baseline | — |
| Typed JSON | 25,621 | +7.3% | 5/7 |
| MessagePack map | 30,020 | +22.8% | 7/7 |
| MessagePack array | 30,453 | +25.2% | 6/7 |
| CBOR map | 26,288 | +12.4% | 6/7 |
| CBOR array | 31,594 | +28.7% | 7/7 |
The matrix retained 42 trials and 17,252,140 successful responses, with zero socket errors or non-2xx responses. Paired gains compare candidates with JSON inside each repetition. They differ from dividing aggregate medians. CBOR map had worse aggregate p99: 4.10 ms versus JSON’s 3.55 ms.
These are codec prototypes for a compact API workload. They are distinct from the later released schema/CBOR API, the marketing homepage, database workloads, native UI, and compiler-wide performance claims. Positional formats also need an explicit versioned contract.
Round 22 adds 49 retained trials and 18.73 million successful responses. We already have a reader-facing research overview and a technical report to build on.
Follow the profile into the application
September's Pet Tracker research bounded page state to 50 visible records. At 10,000 total records, p95 model CPU fell from 52.162 to 0.349 microseconds, and allocation from about 320,050 to 2,080 bytes. Full rendering and the measured HTTP path stayed essentially unchanged. The smaller operation became cheaper without a complete-request speedup.
An Instruments profile then found repeated regex compilation in Asset Pipeline's touch-target renderer. Caching two immutable patterns preserved identical HTML and reduced median paired full-render CPU by 24–32% across three data sizes, with 21 alternating pairs per size. A separate 600-render trace recorded 26.4% fewer whole-process cycles. The retained patch has open integration gates; release inclusion is unverified.
The CLI's September report also records a 50-row component cache experiment: cold p50/p95 19.834/42.834 microseconds versus prewarmed 0.875/1.083 microseconds. Its raw timing samples have not been located in this pass. Four alternating PGO comparisons produced no stable p95 gain. Keeping inconclusive results helps contributors choose their next experiment.
Model baseline · Model candidate · Paired renderer trials · Cycle counters
Retained local application and component measurements, separate from framework throughput and compiler-wide claims. Model batches, renderer pairs, output hashes, and cycle counters were reconciled in this pass.
Make research part of contributing
Issue proposal → profile or audit → baseline → one focused change → paired results → keep or reject → PR → released version.
Each optimization should leave a short explanation of the problem, the measured change, and the decision. Link exact source and tool identities, raw samples, behavioral checks, limitations, and the eventual release. Preserve useful rejected experiments too; they explain the choices in the accepted design.
The release note gets one sentence and a research link. The full method stays with the owning repository and becomes part of the shared research library.
Read the proposed research standard · Read the detailed overview